Finding better ways to help workers keep their eyes on the prize—whether it’s monitoring key performance indicators (KPIs) for productivity and quality or detecting the reason for a fault in a machine’s performance—is leading to the development of increasingly sophisticated visualization tools for human-machine interfaces (HMIs) and supervisory control and data acquisition (SCADA) applications.
The key goals are threefold: enable mobility, so workers can see what’s happening on whatever screen they’re using, whether standard HMI hardware, smartphone or tablet; provide context beyond the machine level to support data interpretation and decision-making; and empower workers to take action from wherever they are, enabling them to respond in real time even from remote locations.
What many of the latest products have in common is the use of web technologies that are tearing down the proprietary walls that have long created barriers within and between industrial systems. With interfaces that are more intuitive—and more similar to their personal technologies—operators find the tools are easier to use and require less training.
As is happening around industry, particularly in IT-facing scenarios, consumer experiences are setting the template for what workers expect from their industrial visualization systems. “I can track my Uber car on my phone. I can search on anything in Google. I can do anything in a web browser. I can do anything on my mobile device. I can share docs in real time in Google. Websites recommend things for me based on what I do,” notes Michael Risse, chief marketing officer at Seeq. “All of these consumer experiences become expectations for the applications that people use at work.”
Seeq has incorporated this level of experience into its Seeq Workbench. “So [users can] search [it] like Google, work in a web browser, work in real time with colleagues, do complex calculations, interact with data at the speed of thought, predict outcomes, cleanse the data,” Risse says.
Seeq Organizer enables the distribution of time-relative analyses to others in a way that lets the recipient get directly to the underlying data, Risse adds. “So we don’t call them reports because they are not pictures of data, they are links to the data; it’s live, you’re on it, and the old decoupling of user from data is eliminated.”
Giving access to real-time data and analysis to operators is growing in importance—providing operators a better understanding of how their decisions affect the overall business. Visualization tools allow operators to make decisions and take action without waiting for a supervisor’s approval or the next staff meeting.
This “empowerment at the edge” is changing how plants are operated, according to John Krajewski, director of project management for the HMI and SCADA portfolio at Aveva, formerly part of Schneider Electric Software. “The shift to real-time decision-making,” he says, “is changing the focus of employees from operating the process to operating the business.”
Aveva has developed Insight Performance—a secure, managed-cloud platform—that enables end users and system builders to collect, visualize and analyze equipment utilization and efficiency data to drive plant performance and share best practices across the enterprise. It can be accessed with Wonderware InTouch HMI software through an HMI or mobile communication device.
“It’s a situational awareness tool to bring an operator’s attention to what’s most important. Insight Performance provides operators with intuitive KPI dashboards and real-time visibility into current downtime causes, empowering users to take immediate corrective action,” Krajewski says. “Advanced reporting and analysis capabilities, which can access equipment performance history from anywhere within the plant or the enterprise, allow continuous improvement and best practice standardization. OEMs can also use it to provide value-added services.”
More graphics, less programming
Graphical displays that can appear on any device without programming help make information easier to understand and more actionable. This is part of what’s enabled by web-based technologies—the ability to more easily get to information from any type of device.
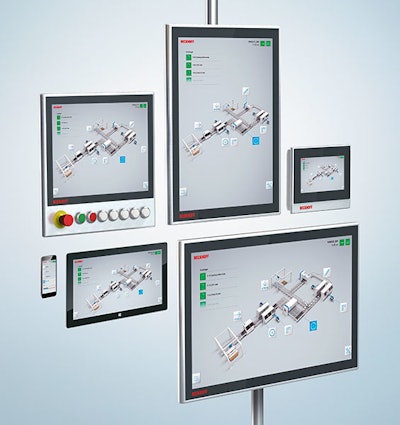
Beckhoff Automation’s new TwinCAT HMI software leverages IT standards such as Microsoft Visual Studio for the engineering and HTML5 and JavaScript for the design, along with WebSockets and HTTPS for secure communication. The graphics editor configures the HMI with no programming required, adapting the display to suit the screen in use regardless of the operating system, browser or device.
This basic architecture facilitates numerous application scenarios, from the local HMI panel to multi-client, multi-server and multi-runtime concepts. “Depending on experience and application, the HMI logic can be implemented with drag-and-drop graphical language in JavaScript or as a server extension,” explains Daymon Thompson, North American automation products manager for Beckhoff.
The company’s TwinCAT Analytics software will also receive an upgrade in mid-summer 2018 with the introduction of a graphical, drag-and-drop analytics toolbox. Part of the massive adoption of web technologies for machine visualization, this diagnostics software includes online and offline condition analysis, predictive maintenance, pattern recognition, machine optimization and long-term data archival capabilities.
“Seamless and cycle-synchronous data acquisition is a prerequisite for effective analysis and correction of processing errors in machines,” Thompson says. “Standard web technologies make products like these forward-compatible, since you never know exactly what type of device you may want to visualize data on in the future.”
Visualization on any device
Today, there’s an increasing push to be able to visualize data on a mobile device of some type—smartphone, tablet, etc. Mobile technology like this has long been used in the oil and gas industry to support decision-making for field worker rounds, lock out/tag out inspection, field worker training, and alarm and event management.
Other industry segments, such as water and wastewater, food and beverage, and power, are now taking advantage of new mobile applications, allowing employees to access a software-only version of the system that they can load directly onto their own mobile devices. “This significantly reduces the barrier of entry for mobile technology in many applications,” says Matt Newton, senior portfolio marketing manager for Aveva’s asset performance management business.
“Gone are the days of operators being tied to a hardwired terminal or HMI to achieve situational awareness on asset health,” he adds. “With vendors increasing their support for mobile and web technologies like HTML5 and cloud-based platforms, operators are now able to carry around a virtual version of their plants and assets right on their mobile device, allowing them to make the right decisions at the right time, regardless of their location.”
Cloud-based systems that connect workers in real time to various enterprise systems such as enterprise asset management (EAM) are also gaining popularity with companies because they enable different business units to work together. “Visualizing KPIs, work orders, process data and other information critical to the business in real time on their mobile devices makes workers more efficient and effective,” Newton says. “Offsite experts can also better guide operators through maintenance and repair procedures, which helps keep equipment up and running and decreases unscheduled downtime.”
Getting troubleshooting help from outside the walls of a facility is an important part of visualization developments, according to Matt Wells, vice president of product automation solutions for GE Digital. “With fewer in-house experts and continued cost-cutting, manufacturers are now relying more on support that’s outside the plant,” he says.
GE Digital recently introduced a number of upgrades to its Cimplicity and iFix HMI/SCADA software to include Web HMI 2.0, which is fully HTML5-compliant. Screens can be scaled to various form factors and orientations for viewing on high-resolution displays. “These new web-enabled HMI products respond to those needs, enabling troubleshooting to be handled remotely, either from the other side of the plant or from a control room hundreds of miles away,” Wells explains.
Web HMI 2.0 reduces development time by up to 40 percent, Wells says, by starting with a structured asset model that can then be mapped to the SCADA database. Assets need to be defined only once for each class. Pre-defined objects and templates are ready for use out of the box. A model-driven window view called Cards includes HMI, alarms, alarm summary, trends and control, and can be customized. It is compatible with Safari, Google Chrome or Microsoft Internet Explorer browsers and can be accessed for mobile operations on either an iPad or Android tablet.
“By eliminating paper and enabling mobility so that workers don’t have to move around the plant to maintain control systems, our HMI products can help improve operator consistency and performance,” Wells says.
Industry is also following the consumer lead on heads-up technologies like augmented reality (AR) and virtual reality (VR) to enable improved insights near an asset.
“Augmented or virtual reality, when combined with other technologies such as the Industrial Internet of Things (IIoT), mobile devices, wearable technology and data analytics, will further empower operators to make informed decisions as they interact with devices in the field,” says Hayden Serio, senior engineer for Maverick Technologies. “This is an intuitive method of training, and providing information that may prove invaluable in helping to retain and transfer the operational knowledge of long-term employees to the next generation.”
Hardware upgrades
For traditional and mobile screen formats alike, vendors continue to make hardware advances as well—making visualization possible, for example, in more hazardous or otherwise difficult environments in the field or in the factory.
Tru-Vu Monitors, which supplies industrial-grade LCD monitors and touchscreens, has released a 24-inch waterproof sunlight readable display designed to operate in direct, bright sunlight, or in other high-ambient light conditions. The NEMA 4X waterproof, stainless-steel enclosure can handle operating temperatures of -4 to 158 °F.
Honeywell has introduced a rugged handheld computer for mobile workers built on the company’s Mobility Edge Platform. The Dolphin CN80 is a hybrid device that incorporates a traditional keypad and a large touchscreen interface. It is designed for distribution centers and other field mobility applications, with options for cold storage or hazardous location environments. It can withstand multiple drops onto hard surfaces and the extended battery life supports long shifts, extended talk-times and heavy GPS use.
“For employees who work in challenging locations or who have applications that rely on keyed shortcuts to speed data entry, a physical keypad remains a popular option for capturing mission-critical information,” says Lisa London, vice president of marketing and offering management for Honeywell’s productivity products business.
A new touch-panel HMI in Phoenix Contact’s TP 3000 series supports gesturing, similar to a smartphone, that allows the user to swipe between screens. “Support of HTML5 web technology is changing the HMI operator panel landscape,” says Bjoern Falke, product manager for HMI/IPC at Phoenix Contact. “It allows a new generation of protocol-agnostic HTML5-enabled panels to easily connect to any web server, be it on a PLC, a drive or other smart automation component.”
The data behind the curtain
What is being done with the data behind the scenes is a whole other topic of discussion. But it’s worth noting here the ability to work with the data that’s presented on the display. “Just spitting data out onto a screen is not useful,” says Sharon Billi-Duran, visualization software product manager at Rockwell Automation.
FactoryTalk Analytics for Devices is a standalone Rockwell product that sits on a network, polling devices to determine their current status and create a dashboard to display any that have an exception or error. The software’s voice-activated chatbot, known as Shelby, can be used to teach the system what information is important to an individual user, allowing the data to be customized for a device or the viewer’s functional role.
“An operator can have a targeted conversation with his or her equipment, or dig deeper if more information is needed,” Billi-Duran explains.
Separating out visualization from analytics and from advanced analytics is not always easy, Seeq’s Risse contends. “Can you just see the data, or can you manipulate it, or can you leverage recent innovations to get more out of the data than was possible in the past?” he asks. “More visualization isn’t the answer—changing the quality of the visualization experience is what’s important.”