In a sluggish economy, manufacturing and packaging companies need to make every second of production time count. Uptime is vitally important to Overall Equipment Effectiveness (OEE), one of the most widely used measurement systems for helping producers understand their operations and drive continuous improvement. OEE is the measure of how closely the production line’s actual performance tracks to its theoretical performance limits, with uptime playing a crucial role.
Maximum uptime can be difficult to achieve, however. Dun & Bradstreet reports that 49% of Fortune 500 companies experience at least 1.6 hours of downtime per week. That translates into more than 83 hr/yr.*
True costs of downtime
Profitability depends on having production machinery up and running reliably and consistently. The true cost of downtime is highly individualized and tougher to calculate. A 2012 preventive maintenance survey of companies across numerous industries found a wide range in the average cost per hour of unplanned downtime, with nearly half citing downtime losses of more than $10,000/hr.
The downtime cost differences between industries, even among companies in the same industry, arise from variances in business size and scale, operational models, current demand levels, regulatory and business requirements, geographic location and several other factors. In the food and beverage industry, for example, it’s estimated that the cost of downtime varies between approximately $5,000 and $10,000/hr, with much of the unplanned downtime occurring on the second and third shifts.
Understanding what’s happening during those second and third shifts could be crucial to minimizing downtime and future losses. The time of day may be a valuable clue—or a mere coincidence—but it’s a long way from understanding the root cause and correcting it. Many factors can cause unplanned downtime and influence its total costs. To minimize losses, companies first need to investigate root causes, as well as both direct and indirect costs of unplanned downtime.
While labor is wasted during downtime, associated overtime to recover the output may further add to downtime cost. Labor costs for the duration of the outage and potential subsequent overtime costs must be taken into consideration. In addition, while labor is an important factor, it would be a mistake to overlook other cost drivers. These may include direct losses due to late penalties, scrap, rework, etc., as well as indirect losses such as the risk to future revenues because of customer dissatisfaction. (See Figure 1—Calculating the Cost of Unplanned Downtime for specifics.) Once these costs have been realistically estimated, it becomes apparent that even a fractional increase in unplanned downtime can have a powerful effect on revenues and margins.
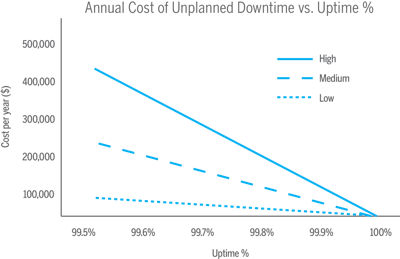
For a packaging operation, the graph in Figure 1 plots costs per year for each additional 0.1% of unplanned downtime, from 100% uptime at the right side to 99.5% uptime at the left. “High,” “Medium,” and “Low” refer to the hours that the packaging equipment is expected to be up and running and the estimated costs per hour of unplanned downtime:
High = 24 hr/day, 7 days/wk, 50 wk/yr; $10,000/hr of unplanned downtime
Medium = 16 hr/day, 7 days/wk, 50 wk/yr; $7,500/hr of unplanned downtime
Low = 8 hr/day, 5 days/wk, 50 wk/yr; $5,000/hr of unplanned downtime
It’s clear that even a small increase of 0.1% in unplanned downtime can result in a substantial shift in net profitability. The larger the operation, the larger the total impact—but even small companies can ill afford unnecessary costs that represent a significant percentage of their overall revenue.
Maximize uptime through optimized OEE
Leading manufacturers quantify the OEE of their processing and packaging lines as part of their efforts to drive uptime and productivity. Improving OEE is seen as an important key to gaining and maintaining a competitive advantage, but smart optimization of OEE requires more than just analyzing uptime and throughput numbers. It requires a deep dive to discover the reasons behind the numbers and the opportunities for improvement.
Methods of measuring OEE vary, but all attempt to provide an objective measure of actual manufacturing unit performance against theoretically ideal performance. Most OEE methods focus on three key measures: availability, performance, and quality. While all three factors affect OEE, availability is essential because only while the machine is running can you work to improve quality (less defects) and performance (run faster). Therefore, uptime is the keystone that everything else depends upon.
All components of processing and packaging equipment have the potential to detract from the OEE of the production line. Having summary data on availability, performance and quality is an indicator of lost OEE, but it is not a tool for improvement. Understanding the cause of downtime provides the basis for action.
Processing and packaging equipment typically capture high-level data to help evaluate performance. In most cases, however, they don’t quantify availability and quality in a useful way, if at all. If availability data is provided, it’s usually as a simple uptime percentage with no distinction between planned and unplanned downtime and no additional information that can help in analyzing the causes of unplanned downtime.
Some companies run their own offline analysis, relying on busy production staff to enter reason codes to describe what is happening as it occurs. This is a time-consuming burden, and any system that relies on human intervention is subject to human error. Critical data may often be incorrect or missing when it’s needed to understand when and why equipment is unavailable.
Moreover, the data received from equipment must be configurable to the type of OEE system being used and must provide enough information to support analysis that can lead to actionable fixes for future OEE improvements. These fixes could point the way to changes in standard operating procedures, staff training, equipment selection, and more—but these avenues for improvement can go undiscovered without adequate data and appropriate analysis tools.
The role of coding printers in uptime and OEE
One key piece of equipment on any processing and packaging line is the product or package printer—a critical element in the overall uptime performance of the line. To help minimize unplanned downtime, the printer should provide availability data along with information that gives users a clear understanding of the root causes of any issues. What’s required, ideally, is not just data about when the printer was down and what technical errors occurred, but information that can be used to identify and fix both printer and operator-caused errors. The most advanced continuous ink-jet printers on the market today provide this actionable information along with features and functionality to maintain continuous operation.
• Actionable information drills down to the root causes of unplanned downtime. Many printers capture and report availability statistics, but this information has little value for actually improving availability. With more complete data—including what’s happening operationally as well as at human touchpoints—you would have the information needed to drill down to root causes and address them. For this data to be useful, you also need a system that facilitates drill-down analysis, so you’re not just confronted with a long list of hard-to-decipher raw data. Ideally, the system should provide quick access to useful information that helps you reliably identify key drivers of downtime.
• Advanced ink calibration capabilities help ensure consistent and reliable print quality. Even small changes in ambient temperature and humidity can have a big effect on ink viscosity and print quality. When the printer cannot precisely react to these conditions, the result can be scrap and indefinite downtime as you attempt to track down and resolve the problem. The issues can be minimized with an advanced ink calibration system that maintains constant jet velocity, ink viscosity and drop formation by dynamically controlling pump speed, nozzle drive, and printhead heater temperature. The result is better print quality with less need for printhead cleaning in the ever-changing conditions often found in manufacturing and packaging environments.
• Optimal printhead design results in less ink buildup and more reliable printing. The most frequent cause of unplanned printer downtime is the need to clean the printhead. Any extension of ink buildup below the printhead leads to clipping (when part of the code is cut off during the printing) and other print quality issues, potentially causing scrap and always requiring a production stop and operator intervention to resolve it. High-quality inks are part of the solution and printheads can be designed to minimize ink buildup to allow much longer intervals between printhead cleanings. Also key to good design are components such as the printhead cover and pump design. For high-quality printing with fewer printhead cleanings, look for an internal pump that delivers a positive airflow, filtered to eliminate dust contamination.
It’s not unusual to encounter print quality problems upon startup, especially with older ink-jet printers. One concept that helps alleviate the problem is a built-in printhead auto-clean procedure that operates with every start and stop of the printer. Such a system eliminates ink buildup for more reliable startup for the ink-jet printer and helps to deliver long-term performance and print quality with minimal intervention, thus improving uptime across the entire production line.
Clearly, having simplified and predictable maintenance procedures in place can help minimize the frequency and duration of planned and unplanned downtime. And, while planned maintenance is inevitable, it need not mean excessive downtime. Ultimately, the solution is to find a printing equipment vendor who understands your need to maximize productivity and one that designs equipment for long intervals between predictable maintenance intervals, including maintenance procedures that can be quickly performed by a maintenance team member. This allows for an improved baseline of planned operating time and a significant impact on overall uptime and profitability.
* Source: Henry Martinez, “How Much Does Downtime Really Cost?” Information Management, August 6, 2009.
Article provided by Mark Breunig, Videojet’s Regional Product Manager for their continuous ink-jet business


