AstraZeneca recently piloted a new data collection system from Zarpac (www.zarpac.com) on a packaging line at its Westborough, MA facility to collect data to identify ways to improve uptime. The results of the study were reported in a presentation by Jeff Rosen, senior industrial engineer, Aseptic Manufacturing and Packaging for Wilmington, DE-based AstraZeneca.
The presentation was made March 29 in Philadelphia at the Pharmaceutical Packaging Forum, hosted by Healthcare Packaging and Packaging World magazines.
The case study focused on an alternative analysis that included the number of downtime occurrences and equipment dependencies to identify the area with the most potential to increase uptime. The key reliability metrics used to evaluate productivity improvements that result in uptime increases and the capability to continuously run for longer intervals are Mean Time Between Failures (MTBF) and Mean Time to Repair (MTTR).
Rosen defines MTBF as the average continuous run time between the last stop condition and the next likely stop condition on a packaging line, which may be one machine or a series of machines. He says MTTR is the average time to resolve or repair the cause of the stop condition and begin running the line again.
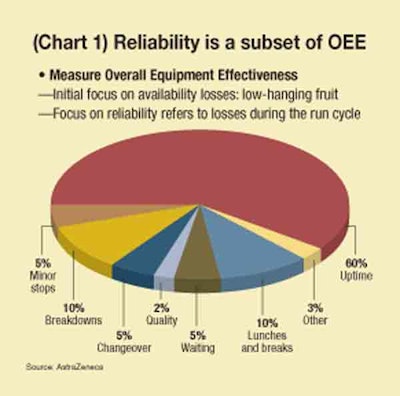
"The focus is on the reliability and uptime connection, showing how reliability is a subset of OEE (Overall Equipment Effectiveness)," says Rosen. "A lot of companies will use OEE as a way to target where they are going to focus their improvement. We need to understand how to frame reliability within that. It will be important to see the reliability metrics so that you can use them." The remainder of this story comes from Rosen’s presentation.
Defining reliability
Reliability is the measure of the likelihood that a product or system will operate without failure for a stated period of time on a packaging line (see Chart 1). How long can we run before a system failure shuts down the line? Uptime is the time during which a piece of equipment or a packaging line is functioning or able to function. We need to target reliability to increase uptime using these metrics. One way of doing that is to look at OEE. But we want to focus on losses during the run cycle, determining the breakdowns or minor stops.
Typically when we go after uptime improvements, we look at percent uptime over a period of a shift, a week, or a month, examining minor stops in minutes. We look at speed of the line and we also look at equipment stop downtime analysis. We develop a chart showing our one biggest downtime category and usually target that area for improvement.
More detailed analysis
But we have to understand that determining the biggest downtime category doesn’t give us the whole picture. We need a more complete analysis. The way we do that is to focus on the reliability losses during the run cycle. When a line goes down for 10 minutes or longer, we call it a breakdown. If a line is down for less than 10 minutes, then perhaps an operator is clearing up a jam. Those are minor, short stops.
We need to determine if we’re running at a designed rate or at our maximum demonstrated production rate. Are we running at that rate whenever we are running? And are uptime losses due to the affect of upstream or downstream equipment? Typically we have more than one machine on a line, with several machines in a series, so we need to know the interaction between those machines. And what is the interaction between the faults that can occur just within one system or one machine? That gives us the full picture if you look at all these metrics. We do this because increased reliability results in less wear and tear on people and equipment.
Certainly if you are an operator relying on equipment that’s constantly stopping, you have to fix it. Minor stoppages can result in bigger breakdowns. They can be expensive to fix and may result in the machine being out of service for some time. That eats into our ability to meet our production schedules and the ability to increase our output capacity if we need to. We want to improve reliability to ensure we can deliver the medicines our patients may require, so it’s real important that we keep the line up as much as possible.
Measurement ‘visibility’
A measurement system should be able to analyze data, identify improvement targets, and indicate if implemented improvement actions are working well. Some metrics are not analyzed in a format that makes them actionable. Actionable metrics are those that indicate the source of loss areas that with improvement will directly increase uptime or mean time between failures. By drilling down through the OEE performance metric we can gain visibility to the reliability-related output loss areas that may offer the biggest bang for the buck.
For example, we know what the OEE of the production line is. We know that the three components of OEE are availability, performance, and quality. In this case study, we’re going to break performance down and look at the internal machine faults. We need to have that visibility of the internal machine faults, the minor stops, the rate loss, and also PLC signals that could tell us the conditions that may eventually cause a minor stop.
We need to look at meantime between failures to see what is the uptime interval duration. At any given point of time when we are trying to run, how long will the machine stay running before it will stop again for a system failure? Then we want to look at stop occurrences. How many stops do we get? How long do they tend to be? What are the stop reason relationships? When does a stop occur and why is that? What is the meantime to repair? How long does it take for the mechanic or the operator to recover and get the machine back up and running?
Next, we need to look at the output loss due to running at less than target speed. We really need to have the right analysis done so that we can figure which of these metrics we should hone in on to provide the biggest bang for the buck.
Westborough details
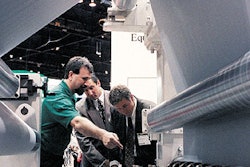
At the Westborough site where I work, we make several sterile products, one of which is packaged on a line that pouches and cartons product. The line consists of an infeed system on the front end, with a foil wrapper, cartoner, checkweigher, and manual case packer. It’s a basic line and we get data out of the line in two ways: From the PLC to the computer onboard the equipment, or directly from the operators. We do this through an operator interface, so there is a way for operators to comment on faults that occur, as well as tell us other reasons why the line may be down.
The cartoner is really the key machine on this line because it sets the pace for the finished output. It’s a bottleneck due to its rate of speed and due to the number of stops we happen to get with the cartoner versus the other pieces of equipment.
By analyzing the state of this line, we learned that we would lose 24% of our output due to unplanned equipment downtime (see Chart 2). One of the first steps we took was to look at what’s called a "Gap Analysis Rate." We saw a 12% output loss due to the stops on the cartoner. There were also some other output losses due to starving the cartoner and also not running at rated speed.
When we look at meantime between failures, again, it’s the cartoner stops and determining the average time until the next fault occurs once we start running. We stopped for faults about every 34 minutes on average. The cartoner puts six pouches and two inserts into a carton. If everything is not aligned properly, the system will fault out, we’ll get this product not inserted fault and the machine stops. The operator has to clear the jam and get the machine running again.
Manual stopping uncovered
We also saw that we could run for 121 minutes before the machine would stop again. That was because somebody would hit the cycle stop button. We saw that this was pretty high for cycle manual stops. Operators were trying to prevent this jam from occurring, so they would stop the machine before it would occur.
The analysis for just this one fault condition indicated that the machine could run for approximately 34 minutes before stopping again for the same fault. It normally didn’t even run that long. It would run for maybe five minutes or so before it would stop for almost any fault.
Next we conducted a competing cause analysis. This helped us take into effect multiple output loss occurrences and dependencies. We ranked these in order from high to low to show the biggest potential, if you were to fix any one of these faults. We noticed an area indicating product not inserted and cycle stop push-button alarm was pressed. If we fix a portion of these faults, this tool estimates how much uptime we are going to get back or how much reliability to expect.
Most of the time when we improve one of these conditions, we don’t eliminate the fault by 100%. In this case, we estimated that we would reduce product not inserted by 50% and thereby reduce related cycle stops by about 25%. The analysis tells us that the potential result is a 4% uptime increase to 77%, with an 18% improvement in meantime between failures. As a result, we can run the cartoner for a longer period without stopping. But the nature of the faults is that if you fix one, chances are there is another stop that’s going to take its place. We need to see the cartoner as a system that could have several hundred faults across it.
Statistical base line
The follow-up piece to the initial analysis requires a statistical base line to identify when an improvement takes place. Here again we can use meantime between failures as one method to understand where our base line is. Right now, we can run for about 1.4 minutes before the cartoner is going to stop for any number of faults. We need to understand this baseline so when we try to make an improvement we can go back and use this tool to see if we have actually improved and how much we have improved by.
We can do the same with uptime by looking at the current uptime availability at 69%, versus the 83% goal we have for this line. We can see that we have operator input and the system allows us to capture the condition from the computer onboard the machine from the PLC, which told us that the product was not inserted all the way into the carton. That gave us better information than we had when we didn’t have automatic data collection on this line. We had our operators collecting data by hand and it was difficult to do this targeted improvement.
Based on this information, we had the mechanic focus his attention on this and he found that a leaflet was out of position, and it was happening frequently. So the mechanic determined the root cause to be that the paper leaflet was not in the proper location for loading. The issue was addressed, which resulted in minimal stops for that fault. Then we measured directly for meantime between failures for that fault and learned that we made an improvement.
More improvements
We then wanted to come back and see how much uptime that gave us across the line, with all these machines connected together. We could go back to our competing cause analysis and confirm improvement in process reliability. We saw that there was a 41% gain for process reliability because there was a decrease in the potential output gain. Therefore the improvement has increased actual output.
We experienced the same thing with the cycle stopped push-button alarm. The potential output to gain anything there was reduced. We knew that we improved the system. We confirmed it going through our meantime between failures trend analysis. It showed that for the cartoner, as a whole connected system, we went to two-and-a-half minutes versus the previous 1.4 minutes. We also saw an uptime trend analysis and confirmed improvement, going from 69% to 76% uptime on the cartoner.
It’s important to have these statistical tools so you really know how much you have gained. At AstraZeneca, we can also use this type of method to justify other improvements we want to make. We can get closer to predicting what kind of cost savings we are going to get out of this.
So there is a real benefit to increasing reliability, and that benefit is longer sustained runs, instead of the prior condition of a five-minute run before the machine would stop on us for any number of reasons. We are now running in the 20-minute range before a fault occurs. We want to get to that 20- to 30-minute range of continuous run cycles.
You need to conduct reliability analysis and focus on those frequent stops that reduce the longer intervals of running, measuring meantime between failures. Consider the entire line as a system. Consider all the interactions between machines in a series, as well as all the faults that can stop the machine.
The information by itself doesn’t do anything. You need to take action to improve reliability. In our case, we held training sessions with engineers and mechanics to conduct line analyses. After all, they are the ones working on the line day-to-day and reviewing the data for improvement opportunities. They need to understand how to use the tools so they can improve reliability.