The annual Institute of Packaging Professionals (IoPP) Salary Survey is always a revealing benchmarking tool. But this year, the 2022 edition offers a particularly interesting snapshot of an industry and a workforce in flux. 
After two years of survey respondents telling us they were reacting to pandemic uncertainty by hunkering down, staying put, and avoiding the risk of seeking greener pastures, the most recent crop of responses shows that an increasing number of respondents have recently found, or are likely to seek, new employers. Given an already tight labor market and the more recent “Great Resignation” trend, this pushes soaring salaries even higher, meaning management will have to invest in order to retain talent. Furthermore, it appears those employers are willing to make that investment in employees in younger and earlier age and experience cohorts than ever.
The Big Picture
The responses map quite well to the existing packaging workforce milieu and “Great Resignation.” Labor is scarce and hard to retain—that set of circumstances precipitates a wide range of trends.
The biggest takeaway is that the balance of power has shifted away from the employer and toward the employee. One illustration of this can be found in the write-in answers on page 48. When asked what keeps them up at night regarding job security, 23% of respondents said “Nothing,” an unprompted, specific answer that’s reinforced by 84% of respondents telling us they are somewhat or very secure when asked about job security in a multiple-choice question.
Another 9%—again, without any prompting—said “Job Satisfaction” keeps them up at night. If labor were copious and cheap, job satisfaction would be a mere confection, a nice-to-have luxury. But 1 in 10 of the respondents to this survey say job satisfaction is a factor in whether they will stay loyal to their employer. This shows that companies aren’t just competing on salary for labor. They’re also competing on intangibles like job satisfaction, meaning, purpose, and doing good for the world. My PMMI Media Group colleague Sean Riley recorded a recent podcast on this phenomenon, with his workforce expert guest Dr. Jessica Kriegel telling him, “there is a war on talent, and the talent won.”
In this environment, employees are aware of their worth. We’ve seen two years of respondents weathering pandemic-wrought uncertainty by exhibiting a “staying put, hunkering down” behavior, leaning on reliable existing employment, and avoiding the risk of the unknown—in other words, preferring the devil they know vs. the devil they don’t. But in this year’s results, we’re seeing a shift toward new job-seeking and greater risk-taking. In fact, 19% of respondents voluntarily changed employers last year, up from 11% the previous year. Also, loyalty remains high, but slightly more respondents are likely to seek new employment in the coming year (32% now vs. 30% last year), and slightly fewer plan to stay put (53% now vs. 55% last year).
This increased mobility among employees is forcing employers to up the stakes to retain them. The overall average salary reported by the respondents went up to $130,070, up 7% from last year and an all-time high in PW’s reporting on the survey. But the dollar figures aren’t just going up evenly across the spectrum of age and experience. Employers are using a strategy of rewarding promising newer and younger employees with bigger, earlier salary jumps, hoping to lock them in.
It always has been the case (and still is) that the oldest, most experienced, most educated people command the highest salaries. But the fastest pace of salary change by percentage gained is becoming more concentrated in the upwardly mobile youngest age cohorts, and among the least experienced respondents. Over the past few years, IoPP’s Jane Chase and I have often cited “after about the five-year mark” as the experience benchmark after which employees can expect to see the biggest salary gains (watch a video of Jane and I talking about last year's results, this time last year, by clicking here). That’s changed; the biggest jump, one of 23%, is now reported to happen after 2 years of experience, headed into the 3- to 5-year experience cohort.
The youngest and least experienced respondents also are more likely than their older, more tenured peers to be confident about salary gains. This is true both in having received them in the past year, and in expecting to receive them the following year. These younger and less experienced folks are more secure in their jobs, too. The only pay category that appears to correlate more closely with older and more experienced respondents is confidence in bonuses, both in having received one last year, and in expecting one next year.
A disappointing finding in this year’s results was the persistent and growing gender-based wage gap, now up to 22% in favor of men from 17% last year. Much of this stems from the fact that female respondents were largely younger and less experienced than their male counterparts, and we know age and experience correlate with higher salaries. They also aren’t as frequently working as engineers or in corporate management, two higher earning job duties. But what’s unclear is how sticky, or how fixed, packaging’s overrepresentation of younger, less experienced women is. If today’s female respondents represent an up-and-coming age and experience cohort that is soon to make its way into the highest earning positions, then salaries should work themselves out. But if women in packaging stays static, in its current age and experience distribution (even with women being every bit as educated as men), then the gender-based wage gap will persist.
 Total 2022 Compensation by Job Function
 Domestically, the weighted average salary was up by 6.6% in 2022 over that reported in 2021. This continues a trend toward higher salaries that began last year, when 2021 salaries were 5.7% higher than 2020, and after a dip in 2020 that may have been related to wage freezes, or overall uncertainty at the beginning of the pandemic. The lower- to middle-income categories shrank a bit, while the highest income categories grew. Those reporting that they are earning $60,000-$69,999 or $90,000-$99,999, dropped by 3 and 2 percentage points respectively, compared to last year. Meanwhile, the two biggest increases in salary ranges were concentrated at the top of the pay scale, as people reporting salaries of $175,000-$199,999 or $200,000 or more, each grew by 3 percentage points.
Best Predictors of Salary
What were the top predictors of a salary? After the obvious job function variable—corporate management makes more than operators on average—the three factors of experience, education, and age are the most accurate salary predictors.
Education
- Of the 31 respondents who reported not having an undergraduate degree, nearly half (45%) of them earn more than $100,000. That figure was 36% in 2021 and 25% in 2020. Lack of an undergraduate degree is becoming less of an impediment to success, but more education still correlates with higher salaries, more raises, and better security.
- Those without undergrad degrees earned an unweighted average of $100,970, the first time in PW’s tenure with this study that they’ve averaged six figures. That’s up 6% from $95,380 in 2021, which was up 12% over 2020’s reported $84,500. Perhaps this is an indicator of the tightening labor market, and the need to look outside of the usual undergraduate degree talent pools. Still, the biggest salary gains are to be made once a degree is earned.
- The biggest salary jump based on education, a 22% salary increase, was reported between a high school/some undergraduate ($100,970), and an undergraduate degree ($122,630). Average salaries increase by 18% from undergraduate to graduate degree, and 21% from graduate to doctorate. Note: only 11 respondents reported having a doctoral degree, so it’s a small sample size.
- Certified Packaging Professionals earned an average of $134,310 in 2021, as reported in 2022, 15% more than their non-CPP peers who reported an average of $116,590.
- People without undergraduate degrees are less likely to have gotten a raise in the past year (2021). Only 42% of those without undergraduate degrees reported getting a raise, compared to undergraduate degree holders (76% got a raise), graduate degree holders (66%), and doctoral degree holders (80%).
- People with undergraduate degrees feel more secure in their jobs. 56% feel very secure and 35% feel somewhat secure. Respectively, those numbers are 48% and 29% for those without undergraduate degrees.
- Those without undergraduate degrees are the least optimistic about earning more in 2022 than in 2021. Only 52% of them expect to do so, compared to undergraduate degree holders (66%), graduate degree holders (73%), and doctoral degree holders (60%).
Experience
- In prior years, the largest experience-based pay jump was between the 3- to 5-year range and the 6- to 10-year range. This was 23% last year. This year, respondents say that biggest jump happens even earlier on the experience continuum. A jump of 23% is reported between the ≤2-year range ($95,700) and the 3- to 5-year range ($111,560). We see another strong, but less pronounced pay jump (17%) happening between the 3- to 5-year range ($111,560) and the 6- to 10-year range ($128,240). This means that employers appear to be willing to promote and pay more and more quickly for talented, but less experienced employees than they have in previous years.
- Just as we saw last year, we see another major pay jump as respondents move from intermediate experience ranges to the >20 year mark. This is to be expected since there are some large salaries among careers that have spanned more than 20 years, and may include careers upwards of 40 years.
- Of the six experience cohorts, the three most experienced (10-15, 16-20, and >20 years) are less likely to expect to earn more this year than they did the previous year, and more likely to expect to earn less this year than the previous year. Perhaps this is evidence of plateauing salaries at later stages of careers, and limited upward mobility. After 20 years or more in an organization, people may have advanced as far as they can, and as such salary gains may not be as dramatic.
- Of the six experience cohorts, the three least experienced (≤2-, 3- to 5-, and 6- to 10-years) are all 99% confident in at least earning the same as last year. Respectively, 79%, 83%, and 85% expect to earn more.
- Bonuses are a different story. People at the lower experience levels are less confident in bonuses, and less likely to have received one in the last year. Of respondents with ≤2 years of experience, 47% got a bonus last year and expect to get them this year. Of the 3- to 5-year experience range, 57% got a bonus last year and expect to get one this year. All other experience cohorts were near or above 70%, both in receiving a bonus last year, and expecting one this year. It appears that confidence in bonus correlates with greater experience.
- Experience still pays. The lower experience cohorts do see big salary gains earlier than ever (after ≤2 years), and those jumps, at least as a percentage, are not as dramatic among the 10+ year experience cohorts. Still, those who traverse the plateau and make it to the >20-year cohort see on average a 16% salary jump after 20 years. A chart on page 43, titled “Biggest Salary Gains Coming Earlier than Ever” illustrates this dynamic, and how it’s changed in recent years.
Age
- The largest average salary increase, a 44% jump from $91,740 to $132,440, occurs between the 18-34 cohort and the 35-44 cohort. Average increases thereafter slow to 10% from 34-44 to 45-54, and 16% from 45-54 to 55-64, then we see a sharp drop off in salaries in the >65 years of age (-32%). This is perhaps due to emeritus status, reduced hours, semi-retirement, etc. in the >65 age group.
- This survey once again illustrates that while the highest salaries are certainly among the older and more experienced ranges, the largest percentage gains are to be had early on; in fact earlier on than ever. Also, there may be some diminished salary returns toward the end of a career, perhaps due to limited upward mobility/plateauing, compounded due to planned responsibility reductions. Among unprompted, write-in concerns (chart on page 48), Ageism/Staying Relevant again makes an appearance among 3% of respondents.
- Of the 18-34 cohort, 87% expect to earn more than last year, reflecting the most confidence in a raise of any age cohort. This reflects the greater upward mobility of younger ages. Only 67% of the 55-64 cohort and 38% of the >65 cohort, (about 2/3 and 1/3, respectively) expect to earn more next year.
- Of the 18-34 cohort, 90% are very or somewhat secure in their jobs, exhibiting higher job security confidence than any other age cohort.
- 30% of the youngest cohort, aged 18-34, make more than $100,000 per year. That’s up 4 percentage points from 26% in as reported last year. That cohort also earned 3% more in 2021 ($91,740 reported in 2022), than last year. The previous year, they had earned 8% more in 2020 ($88,980, reported in 2021) than they did in 2019 ($82,560, reported in 2020). Salaries among the youngest cohort continue to grow at or more quickly than the overall averages.
- 33% of the oldest 65+ cohort earn less than $100,000, perhaps indicating reduction in hours or responsibility. They also earn 32% less ($116,250) than the next youngest cohort, 55- to 64-year-olds, who report making the most of any age group at $170,580.
Gender
- The average salary reported by women ($113,970) now trails that of men ($127,900) by 22% in 2021 (reported in 2022), meaning the gender pay gap among respondents on this survey, is growing. This gap was 17% in 2020 (reported in 2021), and 16% in 2019 (reported in 2020).
- Men (72%) and women (70%) reported receiving a salary increase last year at nearly the same clip. The reported size of the raise was similar, too, though women were more likely to report the lowest raise range: 79% of women, and 74% of men reported a ≤5% raise. Meanwhile, only 13% of women reported a 6-10% raise, compared to 20% of men. While these are similar, men reported slightly more raises in general at the outset. Then, the percentage increase of those raises was slightly higher among men. These factors compound to help widen the gap.
- Both men and women reported having received a bonus last year at the same rate, and their expectations for future bonus are about the same. Women are slightly more secure in their jobs, also.
- While the at-first-glance parity on all of these metrics is encouraging, women aren’t reporting quite as many or as high of raises as their male counterparts, which only grows the wage gap. Not to mention, even if there were parity on these metrics, that wouldn’t translate to equality considering that women begin with the disadvantage of a lower average salary as a starting point.
- Women skew younger than men, with 43% being in the 18-34 cohort. Only 23% of men are in that cohort.
- Women are less experienced than men, with more than half (56%) having less than 10 years of experience. Less than a third (29%) of men report having less than 10 years of experience. The experience gap among respondents is even wider than it was last year, when 49% of women claimed 10 years or less experience, compared to 33% of men.
- More women (61%) than men (52%) report having an undergraduate degree only. However, among those with undergraduate degrees, 31% of men and 24% of women report a graduate degree, so a big-picture takeaway is that women and men report roughly equal levels of education.
- 19% of women respondents are engineers, compared to 28% of men. Current programs attracting women to STEM education aim to bridge that gap.
- 5% of women respondents are in corporate management positions, compared to 9% of men. Programs aimed at training women for leadership positions hopefully should help toward more equal representation in this job function.
- Women (21%) are more concentrated than men (11%) is sales and marketing roles.
Gender-based wage gap grows.
The age and experience distribution of women in packaging is a big factor in the now 22% gender-based salary gap. Women less frequently report their job function as engineering or corporate management, a reality that many programs are working to change via youth programs exposing women and girls to STEM subjects and leadership skills. The good news, as it was last year, is that the survey reflects a younger and less experienced cohort of women—with collectively comparable educations—that should eventually emerge into the upper age and experience echelons they previously didn’t inhabit. But if women remain concentrated at their current experience, age, and job duty distribution, that doesn’t bode well for gender pay equality. It is not clear whether the process of women matriculating into higher pay categories is just aggravatingly slow, or if women’s experience, age, and job duty distribution is stickier, more fixed, than we had hoped and anticipated. Compounding the problem, men report slightly more, and slightly higher salary increase raises.
Not All Packaging Jobs Fare Equally
The overall average salary reported in this survey is up 7% in 2021 (reported in 2022) compared to last year. Last year’s salary was up 6% over the previous year, reflecting a marginal acceleration of salary increase. But not all job functions or demographic groups fared the same.
Who won in 2021?
- The Packaging Technology/Design job function, which is one of our largest reporting job functions, made a 14% jump from $124,170 in 2020 (reported in 20201) to $141,190 in 2021 (reported in 2022).
- Money isn’t everything; job security is nice to have, too. Of the 18-34 age cohort, 90% are very or somewhat secure in their jobs, exhibiting higher job security confidence than any other age cohort.
- Respondents who are IoPP Members earn more than non-members, by roughly 15%.
- Salaries in the Mountain Region once again grew, this year by 27% to $151,830. They had grown by 19% the previous year, so the region containing states AZ, CO, ID, MT, NM, NV, UT, and WY is reporting quickly growing salaries. The West South Central region (AR, LA, OK, TX) grew salaries by 18%, and the Mid Atlantic (NJ, NY, PA) grew salaries by 15%, also higher than other regions.
- The Beverage industry reported a 28% increase in salaries to an average of $145,260.
- Pharmaceutical and Medical industry respondents are most bullish about the receiving a raise coming year, with 84% and 82%, respectively, expecting to earn more next year than this year. They experienced salary increases of 11% and 7%, and the Pharma industry as a whole is the highest-earning industry among respondents ($165,200).
- Respondents who make it past ≤2 year experience cohort, and grow into the 3-5 year range, have the greatest upward mobility, and received the largest percentage salary jump (23%) between consecutive experience cohorts. In previous years, this had happened after 5 years, indicating a shortening time period of “paying one’s dues” before a big reward. This experience group is in line with other experience cohorts when it comes to expecting a raise in the coming year, though fewer did in the previous year, which stands to reason since its made up of respondents with ≤2 of experience.
- The oldest pre-retirement age group, aged 55-64, experienced a 16% jump over the previous year, to $170,580 from last year’s $147,111.
- Mid-sized companies, from 500-4,999 in size, saw a 15% increase in salaries to $138,800, the highest percentage increase of the various company size ranges. The largest companies (50,000 employees or more) still command the highest salary figures ($151,840), but those numbers could be skewed by a few high-earning C-Suite positions at major global CPGs.
In-line with the average
- Respondents in the Food industry experienced a 7% average salary increase, exactly in line with the overall average.
- The engineering job function is important since it tends to be the single largest job duty represented in this survey. Engineers reported slightly higher salaries this year over last, at $124,190 this year compared to $117,800 last year, but the 5% gain doesn’t quite keep pace with 7% overall. The previous year, engineer salaries increased from $108,700 last year to $117,800, an 8% bump, so this represents a stable, evenly growing job duty category that’s in line with averages.
- The middle age range of 35-44 experienced a 9% increase, reporting a jump from $121,570 to $132,440.
Most negatively affected
- Salaries in the Northeast, and East South-Central, Pacific, and South Atlantic regions are standing pat by barely changing at all (±2% salary change in all these regions), but they are not keeping pace with the overall 7% growth. The East South-Central region of AL, KY, MS, and TN also reported the lowest salaries of all regions at an average of $109,620.
- Among women, average salaries reported only grew 4%, compared to a 9% average salary increase for men.
- Corporate management salaries as reflected in this survey went up by 3% compared to the previous year, from $190,970 to $196,280. While any growth beats the alternative, the 3% increase doesn’t keep pace with the 7% overall salary increase.
- The smallest companies, with 1-9 employees, again saw a salary drop, down 4% from $104,210 last year to $99,700 in 2021 (reported in 2022). The previous year, they experienced a 7% drop in salary, so this is an ongoing trend.
Mixed results
- Last year, the oldest cohort, 65+, experienced the largest year-over-year salary bump of 31%, from $107,250 to $140,350. This was trend reversed, or perhaps reverted to the mean, by returning to $116,250, a 20% drop from the previous year. Also, only 48% of those 65+ expect to earn more next year than this year, much lower than other age cohorts, perhaps indicating upcoming retirement or reduced hours. With smaller sample sizes than other age ranges, and the potential for limited work schedules/reduced hours, it’s difficult to get a good read on the 65+ category.
Employment and Job Security Findings
As a semblance of normalcy returned in 2021, respondents settled into a new routine in a new normal. With a tight labor market and a 5-year high in job security, more respondents are indicating that they will soon look for alternate employment, and even more are saying that they have already switched jobs in the last year. Now that the level of uncertainty around the pandemic is reducing, the impulse to stick to what you know diminishes and greater risk-taking behavior returns. And with this tight of a job market, and employees in high demand, it only makes sense for them to look.
 After a brief dip in likelihood to seek other employment in 2021, we see respondents are again becoming more amenable to seeking out a new employer, though not quite to pre-pandemic levels yet.
Economy the Only Big Threat to Job Security
 Survey participants were asked to comment on what kept them up at night related to job security. A total of 454 respondents* answered this question, with 15% worrying about the economy. It was interesting to see Job Satisfaction ranked so highly among unsolicited responses here, up to 9% of the total, from only three total responses last year. That employees have the luxury to even factor in job satisfaction demonstrates how much of the power has shifted to the employee in a tight labor market era.
 During anytime of uncertainty, regardless of industry, we tend to see a high degree of loyalty as people hunker down and stay put to weather the storm. That’s indeed what we saw in 2020 (as reported in 2021), as we settled into the pandemic era. This year, when asked about what happened to respondents in 2021 (reported in 2022), we still see a high degree of loyalty, but also an uptick in job-seeking behavoir. We’ll see if this continues.
 The average age of respondents fell to 43.4 from 44.8 last year and 44.6 the year before. Younger ages report significant pay increases earlier in their careers than they reported in previous surveys.
 There was very little change in distribution between job functions and industries between last year’s responses and this year’s, reflecting year-over-year stability in respondent mix. Some job duties that are better reflected this year include: Marketing/Sales and R&D. Engineering is a job duty that is slightly less represented in the answer set. Chemicals/Cleaning Supplies and Medical industries were better reflected this year than last, while automotive and materials industries had less representation among responses than last year.
 * Note: Demographic questions were not required to be answered, so the base number for each is slightly less than the 540 total respondents
 Of the 71% of all respondents who reported getting traditional salary increases in 2021, most raises (93%) were of less than 10%, with the vast majority of those being of less than 5%.
 Once again, IoPP members reported higher salaries than non-members, and Certified Packaging Professionals (CPPs) earned higher salaries than their non-certified colleagues. And over the past year, IoPP members and CPPs have widened the gap.
 Respondent confidence is returning, and fear of making less next year is subsiding, in what we all hope to be the wake of the pandemic in a tight labor market.
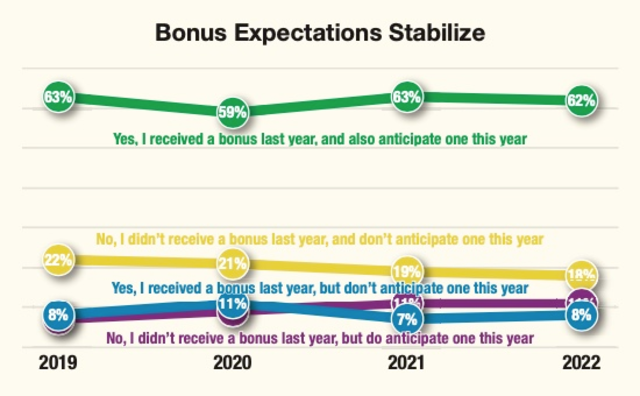 The green blue line (received a bonus last year, expect one this year) dip, combined with the minor blue line (received a bonus last year, but don’t expect one this year) rise in 2020, reflect the uncertainty around the pandemic—responses for that survey were collected just as we entered the pandemic era. This seems to have stabilized, with single percentage-point movement if any between last year’s and this year’s responses (reported in 2021 and 2022, respectively).